• Underemployment Trends
  • Background
  • Updates
  • Executive Summary
  • The data
  • Introduction
  • 1 Time-related underemployment
    • 1.1 Time-underemployment indicator 1: Involuntary part-time
      • 1.1.1 Time-underemployed part-time workers by sex
      • 1.1.2 Time-underemployed part-time workers by age group
      • 1.1.3 Time-underemployed part-time workers by ethnic group
      • 1.1.4 Time-underemployed part-time workers by qualification level
      • 1.1.5 Time- underemployed part-time workers by occupational group
      • 1.1.6 Time-underemployed part-time workers by contract type
      • 1.1.7 Regional trends in time-underemployment among part-time workers
      • 1.1.8 Industry trends in time-underemployment among part-time workers
    • 1.2 Time-underemployment indicator 2: Wanting longer hours
      • 1.2.1 Wanting more hours by sex
      • 1.2.2 Wanting more hours by age group
      • 1.2.3 Wanting more hours by ethnic group
      • 1.2.4 Wanting more hours by qualification level
      • 1.2.5 Wanting more hours by occupational group
      • 1.2.6 Wanting more hours by contract type
      • 1.2.7 Wanting more hours by part-time and full-time employment
      • 1.2.8 Wanting more hours by region
      • 1.2.9 Wanting more hours by industry
    • 1.3 Time-underemployment indicator 3: Seeking a replacement job with more hours
      • 1.3.1 Seeking a replacement job with more hours by sex
      • 1.3.2 Seeking a replacement job with more hours by age group
      • 1.3.3 Seeking a replacement job with more hours by ethnic group
      • 1.3.4 Seeking a replacement job with more hours by occupational group
    • 1.4 Summary: Time-related underemployment
  • 2 Skills-related underemployment
    • 2.1 Skills-related underemployment by sex
    • 2.2 Skills-related underemployment by age group
    • 2.3 Skills-related underemployment by ethnic group
    • 2.4 Skills-related underemployment by qualification level
    • 2.5 Skills-related underemployment by occupational group
    • 2.6 Skills-related underemployment by contract type
    • 2.7 Skills-related underemployment by region
    • 2.8 Skills-related underemployment by industry
    • 2.9 Summary: Skills-related underemployment
  • 3 Wage-related underemployment
    • 3.1 Wage-related underemployment by sex
    • 3.2 Wage-related underemployment by age group
    • 3.3 Wage-related underemployment by ethnic group
    • 3.4 Wage-related underemployment by qualification level
    • 3.5 Wage-related underemployment by occupational group
    • 3.6 Wage-related underemployment by region
    • 3.7 Wage-related underemployment by industry
    • 3.8 Summary: Wage-related underemployment
  • Conclusions and the way forward
  • Technical Appendix 1: The Data
  • Technical Appendix 2: Time-related underemployment
  • Technical Appendix 3: Skills-related underemployment
  • Technical Appendix 4: Wage-related underemployment
  • References
  • The Underemployment Project

Underemployment Levels and Trends: Time, skills, & wages

3.3 Wage-related underemployment by ethnic group

Figure 3.3 shows the rate of underpayment among employees according to their ethnic group. Overall, the gap is not large, though the proportion of underpaid minority-ethnic employees is slightly higher than the white majority employees for most periods. Even the small differences reduced after the Covid-19 pandemic hit.

The proportion of underpaid minority-ethnic employees is slightly higher than their white counterparts

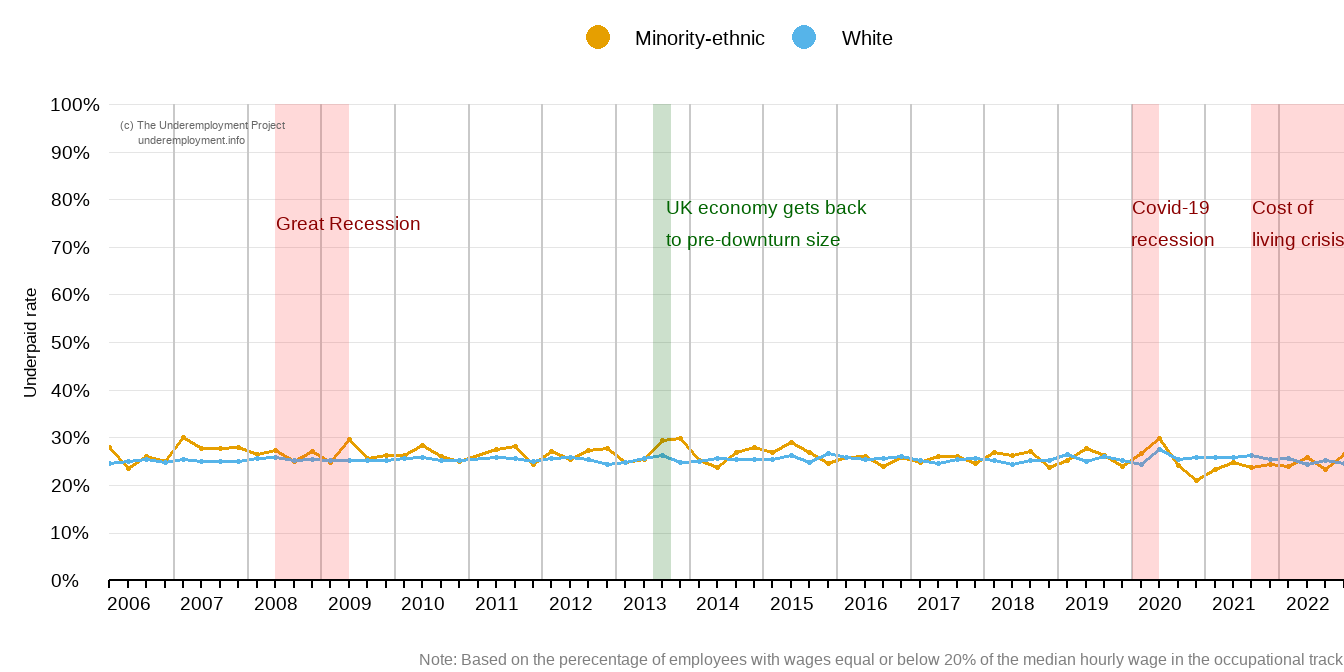
FIGURE 3.3: The proportion of underpaid minority-ethnic employees is slightly higher than their white counterparts