• Underemployment Trends
  • Background
  • Updates
  • Executive Summary
  • The data
  • Introduction
  • 1 Time-related underemployment
    • 1.1 Time-underemployment indicator 1: Involuntary part-time
      • 1.1.1 Time-underemployed part-time workers by sex
      • 1.1.2 Time-underemployed part-time workers by age group
      • 1.1.3 Time-underemployed part-time workers by ethnic group
      • 1.1.4 Time-underemployed part-time workers by qualification level
      • 1.1.5 Time- underemployed part-time workers by occupational group
      • 1.1.6 Time-underemployed part-time workers by contract type
      • 1.1.7 Regional trends in time-underemployment among part-time workers
      • 1.1.8 Industry trends in time-underemployment among part-time workers
    • 1.2 Time-underemployment indicator 2: Wanting longer hours
      • 1.2.1 Wanting more hours by sex
      • 1.2.2 Wanting more hours by age group
      • 1.2.3 Wanting more hours by ethnic group
      • 1.2.4 Wanting more hours by qualification level
      • 1.2.5 Wanting more hours by occupational group
      • 1.2.6 Wanting more hours by contract type
      • 1.2.7 Wanting more hours by part-time and full-time employment
      • 1.2.8 Wanting more hours by region
      • 1.2.9 Wanting more hours by industry
    • 1.3 Time-underemployment indicator 3: Seeking a replacement job with more hours
      • 1.3.1 Seeking a replacement job with more hours by sex
      • 1.3.2 Seeking a replacement job with more hours by age group
      • 1.3.3 Seeking a replacement job with more hours by ethnic group
      • 1.3.4 Seeking a replacement job with more hours by occupational group
    • 1.4 Summary: Time-related underemployment
  • 2 Skills-related underemployment
    • 2.1 Skills-related underemployment by sex
    • 2.2 Skills-related underemployment by age group
    • 2.3 Skills-related underemployment by ethnic group
    • 2.4 Skills-related underemployment by qualification level
    • 2.5 Skills-related underemployment by occupational group
    • 2.6 Skills-related underemployment by contract type
    • 2.7 Skills-related underemployment by region
    • 2.8 Skills-related underemployment by industry
    • 2.9 Summary: Skills-related underemployment
  • 3 Wage-related underemployment
    • 3.1 Wage-related underemployment by sex
    • 3.2 Wage-related underemployment by age group
    • 3.3 Wage-related underemployment by ethnic group
    • 3.4 Wage-related underemployment by qualification level
    • 3.5 Wage-related underemployment by occupational group
    • 3.6 Wage-related underemployment by region
    • 3.7 Wage-related underemployment by industry
    • 3.8 Summary: Wage-related underemployment
  • Conclusions and the way forward
  • Technical Appendix 1: The Data
  • Technical Appendix 2: Time-related underemployment
  • Technical Appendix 3: Skills-related underemployment
  • Technical Appendix 4: Wage-related underemployment
  • References
  • The Underemployment Project

Underemployment Levels and Trends: Time, skills, & wages

3.7 Wage-related underemployment by industry

As Figure 3.7 shows, wage underemployment is most pervasive in the accommodation and food service sector where, in most years, over a third of workers are underpaid (earning at least 20% lower than the median in their occupational category). Employees in education, retail and human health and social work are also affected while the finance and insurance industry group stand out again with the lowest levels of underemployment.

More underpaid employees in the hospitality, human health, education, and retail sectors

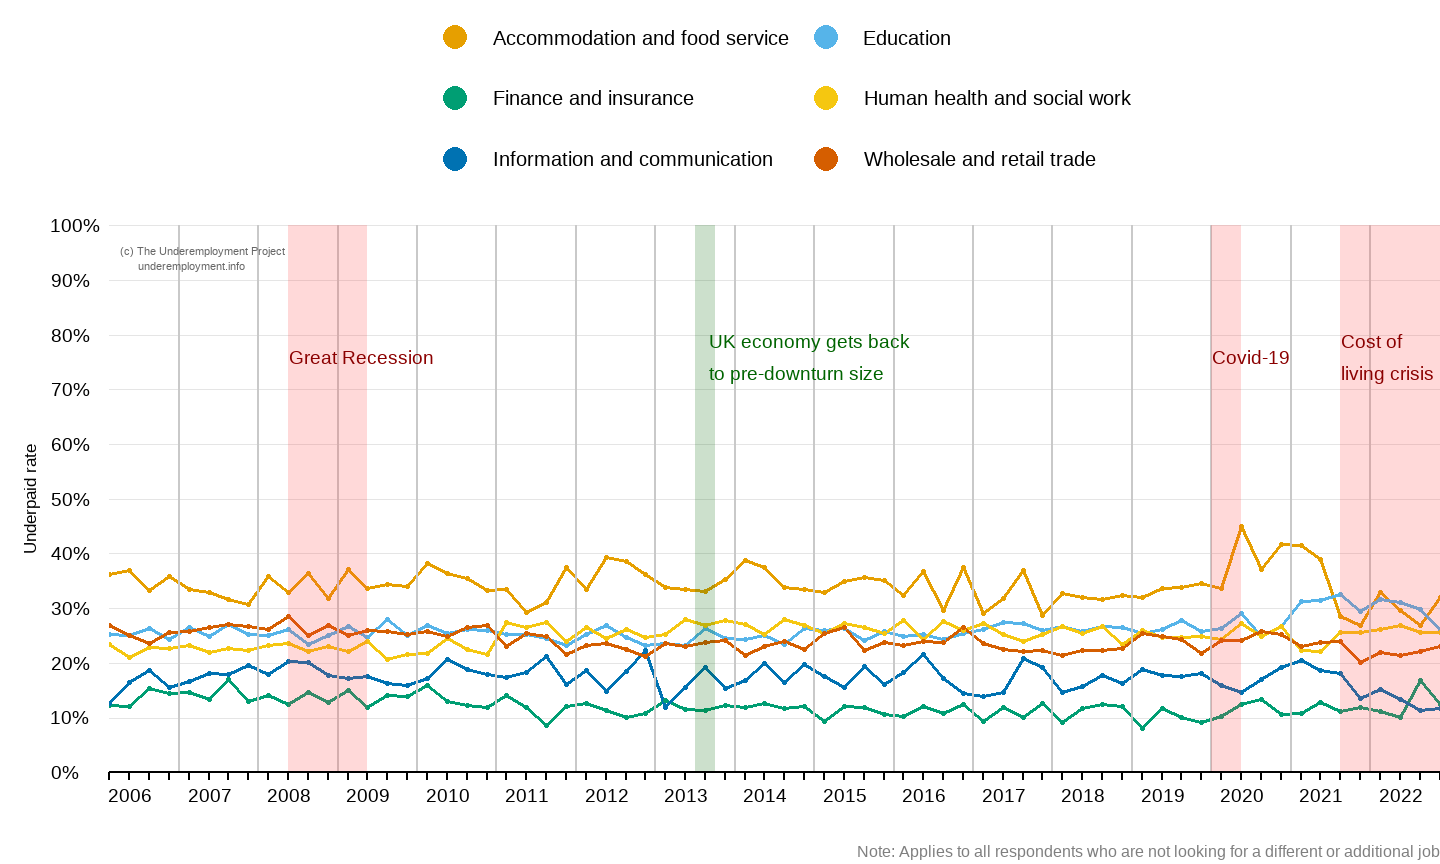
FIGURE 3.7: More underpaid employees in the hospitality, human health, education, and retail sectors